Let me tell you a story: the why!
A year ago, one of those Sunday morning where spring starts to warm up the souls, I went, as usual to my favorite bakery. The family tradition is to come back with a bunch of “Pains au Chocolat” (which, are, you can trust me, simply excellent).
- hello sir, I’d like 4 of your excellent “pains au chocolat” please
- I’m sorry, I don’t have any “pains au chocolat” nor any “croissant” anymore
- what? How is it possible ?
- everything has been sold.
- too bad…
I think to myself: why didn’t you made more?. He may have read my thought and told me
- I wish I could have foreseen
When I left his shop, his words were echoing… I wish I could have foreseen… We have self-driving cars, we have the Internet, we are a civilization that is technology advanced. Facebook recognize your face among billions as soon as you post a photo… It must be possible to foresee…
This is how I started to gain interest in machine learning
At first I started to read some papers, then I learn (a very little bit) about graph theory, Bayesian networks, Markov chains. But I was not accurate and I felt I was missing some basic theory.
That’s the main reason why, 8 weeks ago, I signed in a course about “Machine learning” on Coursera. This course is given by Andrew Ng from Stanford University.
It is an excellent introduction that gives me all the tools I need to go deeper in this science. The course is based on real examples and uses powerful mathematics without going too deeply in the proofs.
So what?
The course is not finished yet, but after about 8 weeks, I’ve learned a lot about what we call “machine learning”.
The main idea of the machine learning is:
- to feed some code with a bunch of data (who said big data was useless)
- to code or encode some mathematical formulas that could represent the data
- to implement any algorithm that optimize the formulas by minimizing the error made by the machine on the evolving data sets.
To make it simple: machine learning is feeding a “robot” with data and teach him how to analyse the errors so it can make decisions on its own.
Scary isn’t it? But so exciting… As usual I won’t go into ethical debate on this blog, and I will stick to science and on the benefit of the science.
But indeed, always remind François Rabelais:
Science sans conscience n’est que ruine de l’âme (Science without conscience is but the ruin of the soul)
A use case
Defining the problem
I have 4 technical solutions providing a similar goal: deliver cloud services. Actually, none of them is fulfilling all the requirements of my business. As usual, one is good in a certain area, while another one is weak, etc.
A team of people has evaluated more than 100 criteria, and gave two quotations per criteria and per product:
- the first quotation is in the range 0/3 and indicated whether the product is fulfilling the current feature
- the second quotation may be {0,1,3,9} and points the effort needed to reach a 3 for the feature
Therefore, for each solution, I have a table looking like this :
| feature name | feature evaluation | effort |
|---|---|---|
| feature 1 | 0 | 9 |
| feature 2 | 3 | 0 |
| feature 3 | 2 | 1 |
| feature 4 | 0 | 3 |
| ……. | … | … |
| feature 100 | 2 | 3 |
I’ve been asked to evaluate the product and to produce a comparison.
To do an analytic, I must look for an element of comparison. So I’ve turned the problem into this :
I would like to know which product is the cheapest to fulfill my requirement.
(I’ve uploaded my samples here):
Finding a solution
In the machine learning, we notice two different fields of application:
- regression
- classification
The classification mechanism would be used to answer a yes/no question; for example: should I keep solution 1 ? The regression mechanism helps us for “predicting”. Actually, the goal is to automatically find a mathematical formulae that turns a set of feature into a result.
what is a feature, and what’s the result? Let’s go back to my petits pains example.
Consider that the baker has made statistics on its production for sunday, and it has taken some events into consideration:
- sunday the 1st: it was raining, I sold only 100 petits Pains
- sunday the 8th: it was sunny, I sold 250 petits Pains
- sunday the 16th: it was sunny, and it was a special day (eg: mother’s day): 300 petits Pains
- sunday the 24th: it was cloudy: 150 petits Pains
Here, the baker thinks that its production must be a function of the weather and the calendar; therefore those are the two features. What ML propose is to tell the baker how many “petits pains” he should make knowing that it is a special day (father’s day) and that it is partially sunny…
Back in the context of this post, the goal of the regression would be to find a mathematical function that will tell me the effort needed for any value, and doing this on the simple basis of the training set I have.
The actual score of all the solutions
The first thing to find it the total score of all the 4 solutions. If I consider $m$ features, the total score of the solution is defined by:
$ score = \frac{1}{m} . \sum_{k=1}^{m} feature_k $
What I need now, is to evaluate the effort needed to reach a score of 3 for each solution. Let’s do that.
Representing the training set
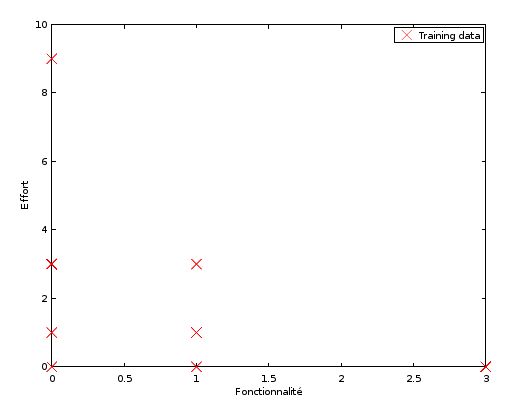
First, let’s plot the training set.

note the representation is not accurate because there may be several bunk points
I will use in this post what’s called “supervised learning”. That means that I will express a skeleton of function and let the machine adjust it. (actually this is a very basic and week implementation; a lot more complex examples may be implemented but that’s not the purpose of this post)
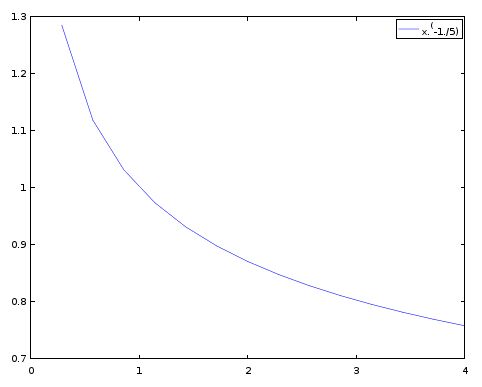
When I look at the training set representation, I can imagine a line passing by the middle of the plots. This line may look like this:

This is actually a representation of the function $ x^{\frac{1}{5}} $
Let’s assume that this function may basically fit my example, my goal will be to adapt the function. assume this equation with two parameters $\theta_0$ and $\theta_1$ that will influence the curve:
$ f(x) = \theta_0 + \theta_1 . x^{\frac{1}{5}} $
Therefore, my goal will be to code something so that the machine will figure out what $\theta_0$ and $\theta_1$ are.
I will use an implementation of an algorithm called gradient descent for linear regression. I won’t go into the details of this algorithm, as it takes a complete course to be explained.
The implementation is made with GNU octave and the code is available on my github
The computation and the result
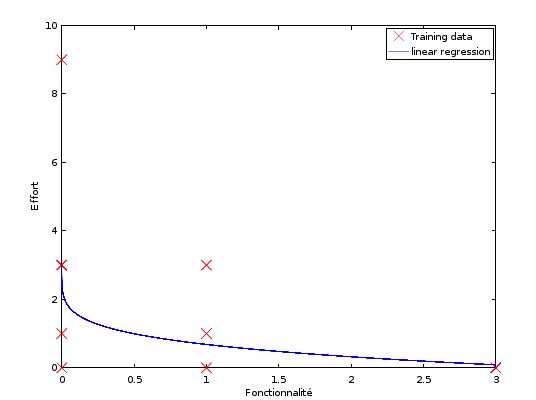
Here is a figure representing the function for one particular solution:

We can see that the curve is “under fitting” the data. Anyway, let’s continue and get the result I want (I will explain later how to perform better):
Here are the computational results:
octave:10> compute Analysing solution1.csv:0.67⁄3 Running gradient descent… Theta found by gradient descent: 5.397050 -4.315835 Prediction for x=0.669291 ; 1.414256 Prediction for x=3 ; 0.020681 Effort (scaled to 10): 2.582105Analysing solution2.csv:0.96⁄3 Running gradient descent… Theta found by gradient descent: 3.178478 -2.451611 Prediction for x=0.960630 ; 0.746482 Prediction for x=3 ; 0.124430 Effort (scaled to 10): 1.957075
Analysing solution3.csv:0.67⁄3 Running gradient descent… Theta found by gradient descent: 2.557847 -2.015334 Prediction for x=0.669291 ; 0.698031 Prediction for x=3 ; 0.047283 Effort (scaled to 10): 2.544122
Analysing solution4.csv:0.86⁄3 Running gradient descent… Theta found by gradient descent: 3.104868 -2.422627 Prediction for x=0.858268 ; 0.755175 Prediction for x=3 ; 0.086926 Effort (scaled to 10): 2.152261
For each solution, I have:
- the score (the first line /3)
- the parameters $\theta$
- a prediction for the actual score, and for a score of 3
- the effort (scale on 10) needed to pass from the actual score to 3
Final result
Here is the final classification of my four solutions:
| Solution | score | effort |
|---|---|---|
| Solution 2 | 0.96 | 1.95 |
| Solution 4 | 0.86 | 2.15 |
| Solution 3 | 0.67 | 2.54 |
| Solution 1 | 0.67 | 2.58 |
Solution 2 is the cheapest. It’s possible to go into further analysis to determine why it’s the cheapest, and how the other ones may catch up and go back in the race, but again, that is not the purpose of my post.
Conclusion
This is a simple approach. Some axis of optimization could be to use a more complex polynomial (eg: $\theta_0+\theta_1.x^\frac{1}{3}+\theta_2.x^\frac{1}{5}$) or to use a support vector machine with a gaussian kernel for example.
One other optimization would be to add some more features, such as, for example, a score on the importance of a feature (a functional feature).
Machine learning is a wide mathematical and IT area. It is now in everyone’s life. Nowadays we are talking about plateform fully automated, self-healing applications, smart deployements, smart monitoring. There are already some good implementations of algorithms on the market, but there is a huge place for integration of those tools into the life of the IT specialist.
Automation has already helped and took the boring job of the IT specialist. Smart automation will go a step further.